CPU 使用率性能分析器 (CPU Usage Profiler)
CPU Usage Profiler 显示游戏中的时间使用情况。选择此选项后,下方面板将显示所选帧的层级时间数据。请参阅有关 Profiler 窗口的文档以了解关于 Profiler 时间轴的更多信息。
- Hierarchy mode:显示层级时间数据。
- Group Hierarchy mode:将时间数据分成逻辑组(例如 Rendering、Physics、Scripts)。由于任何组的子项也可以位于不同的组中(例如,某些脚本也可能调用渲染函数),因此组时间的百分比通常总计超过 100%。
上下拖动图表标签可重新排列 CPU 图表的堆叠方式。
选择各项
在下方面板中选择某一项时,将突出显示其对 CPU 图表的贡献(其余部分将变暗)。再次单击某一项将取消选择该项。
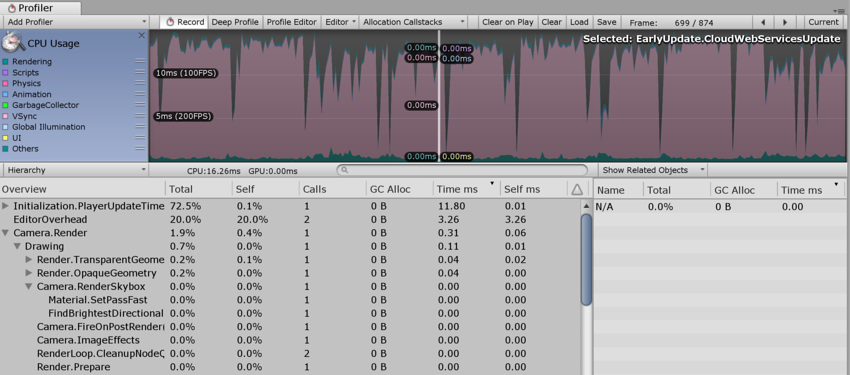
In the hierarchical time data, the Self column refers to the amount of time spent in a particular function, not including the time spent calling sub-functions. In the screenshot above, 1.9% of time is spent in the Camera.Render function. This function does some work in this frame and calls the various drawing and culling functions. Excluding all of these functions, only 0.4% of time is spent in the Camera.Render function itself.
The Time ms and Self ms columns show the same information but in milliseconds. Camera.Render takes 0.06ms but, including all the functions it calls, 0.31ms are consumed. The GC Alloc column shows how much memory has been allocated in the current frame, which is later collected by the garbage collector. Keep this value at zero to prevent the garbage collector from causing hiccups in your framerate.
CPU 性能分析器的 Others 部分记录不属于 Rendering、Scripts、Physics、Garbage Collection 或 VSync 的所有方面的总和。此部分包括 Animation、AI、Audio、Particles、Networking、Loading 和 PlayerLoop。
物理标记
下面的描述简要介绍了各种高级 Physics Profiler 标记的含义。
-
Physics.Simulate:从
FixedUpdate中调用。通过指示物理引擎 (PhysX) 运行其模拟来更新物理系统的当前状态。 -
Physics.Processing:从
FixedUpdate中调用。处理所有非布料物理作业。扩展此标记可显示物理引擎内部完成的工作的低级细节。 -
Physics.ProcessingCloth:从
FixedUpdate中调用。处理所有布料物理作业。扩展此标记将显示物理引擎内部完成的工作的低级细节。 -
Physics.FetchResults:从
FixedUpdate中调用。从物理引擎收集物理模拟结果。 -
Physics.UpdateBodies:从
FixedUpdate中调用。更新所有物理体的位置和旋转以及发送说明这些更新的消息。 -
Physics.ProcessReports:从
FixedUpdate中调用。此阶段在物理FixedUpdate结束后运行,负责处理响应模拟结果的所有不同阶段。更新接触、关节破坏和触发器并发送相关消息。包括四个不同的子阶段:-
Physics.TriggerEnterExits:从
FixedUpdate中调用。处理OnTriggerEnter和OnTriggerExit事件。 -
Physics.TriggerStays:从
FixedUpdate中调用。处理OnTriggerStay事件。 -
Physics.Contacts:从
FixedUpdate中调用。处理OnCollisionEnter、OnCollisionExit和OnCollisionStay事件。 -
Physics.JointBreaks:从
FixedUpdate中调用。处理与被破坏的关节相关的更新和消息。
-
Physics.TriggerEnterExits:从
-
Physics.UpdateCloth:从
Update中调用。进行与布料及其蒙皮网格相关的更新。 -
Physics.Interpolation:从
Update中调用。此阶段处理所有物理对象的位置和旋转的插值。
性能警告
CPU 性能分析器能够检测并警告一些常见的性能问题。查看 CPU Usage 时,这些问题会显示在下方面板的 Warning 列中。
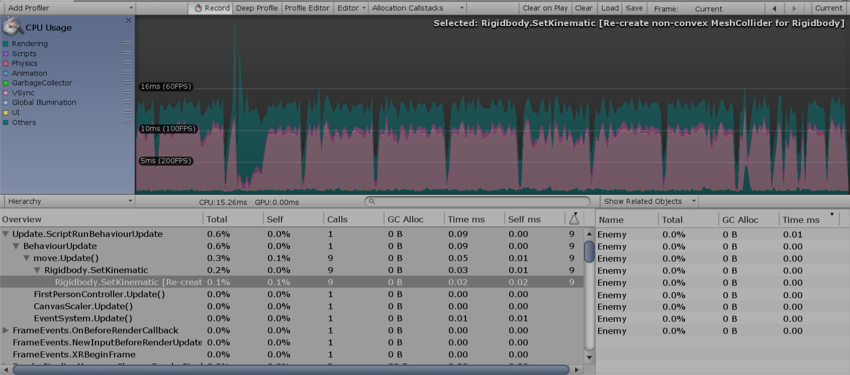
性能分析器可检测的具体问题包括:
- Rigidbody.SetKinematic [Re-create non-convex MeshCollider for Rigidbody]
- Animation.DestroyAnimationClip [触发 RebuildInternalState]
- Animation.AddClip [触发 RebuildInternalState]
- Animation.RemoveClip [触发 RebuildInternalState]
- Animation.Clone [触发 RebuildInternalState]
- Animation.Deactivate [触发 RebuildInternalState]
在上面的截屏中,性能分析器显示了 Static Collider.Move 警告。Warning 列显示此警告已在当前帧中触发 12 次。术语“延迟成本”意味着,虽然性能分析器中的条目可能显示低成本(在此情况下为 0.00ms),但该操作可能会在以后触发更多消耗系统资源的操作。
CPU Profiler Timeline
Mem Record:本机内存性能分析
本机内存性能分析允许在 Unity 的本机内存管理系统中分析活动,并评估对运行时性能的影响。在 Unity 的内存管理中搜索不必要的或资源密集的分配模式时,此分析功能非常有用。
To profile Unity’s native memory management, you need to record it. To access native memory recording mode (called Mem Record in Unity), go to Window > Analysis > Profiler to open the Profiler window. Select the CPU Usage Profiler (if it is not visible, click Add Profiler > CPU) then the drop-down menu underneath the Profiler. Next, click Timeline and then select Mem Record.
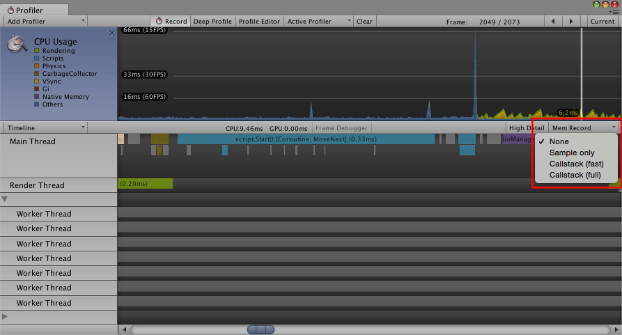
| 选项 | 功能 | 对性能的影响 |
|---|---|---|
| None | 禁用模式。这是默认选择。 | 无 |
| Sample only | 记录内存分配、重新分配、取消分配、活动类型和系统。 | 低 |
| Callstack (fast) | 此选项具有与 Sample only 相同的功能,但还记录来自本机分配站点的快捷调用栈(调用栈从本机符号转换为脚本符号)。实际上,最多只能看到最深脚本符号的调用栈。 | 中 |
| Callstack (full) | 此选项具有与 Sample only 相同的功能,但还记录具有完整脚本到本机转换和本机到脚本转换的调用栈。 | 高 |
注意:当激活的性能分析器仅连接到独立平台播放器时,仅支持低影响力的 Sample only 模式。
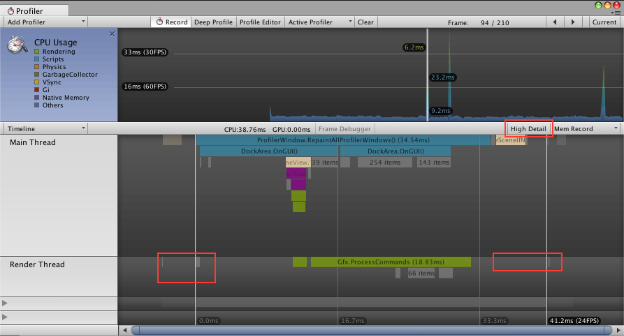
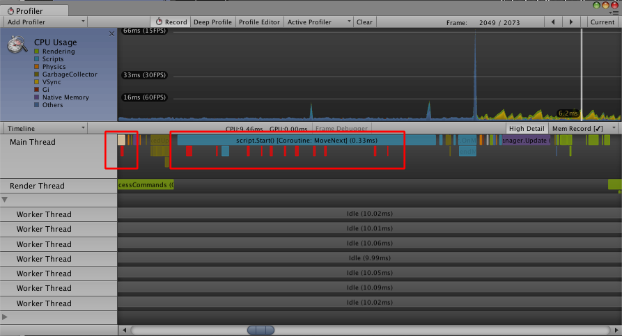
记录的内存分配样本以亮红色显示在 Profiler 窗口中。
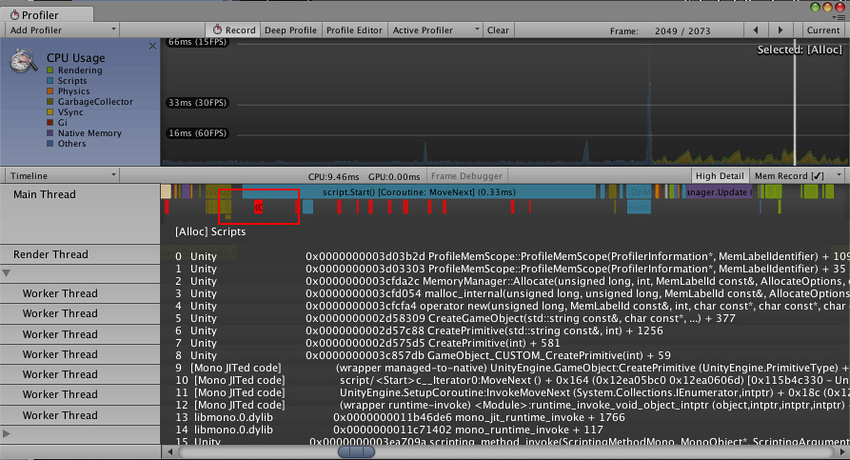
单击 Mem Record 旁边的 High Detail 按钮可启用 High Detail 模式。选择一个样本来显示分配类型和系统。如果为所选分配样本记录了调用栈,则还会解析并显示关联的调用栈符号:
使用 Mem Record
在许多情况下,__Mem Record__ 功能很有用。例如:
- 了解系统何时进行大量小型分配而不仅仅是少量大型分配。
- 了解何时工作线程意外分配内存(例如,通过意外使用 MemLabel)。
- 查找锁争用(多个线程尝试同时访问本机内存系统时)。
- 查找内存碎片的来源(对于低内存设备尤为重要)。
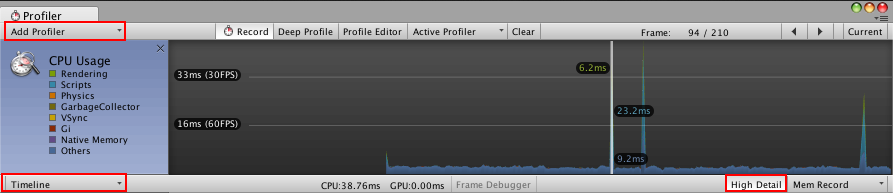
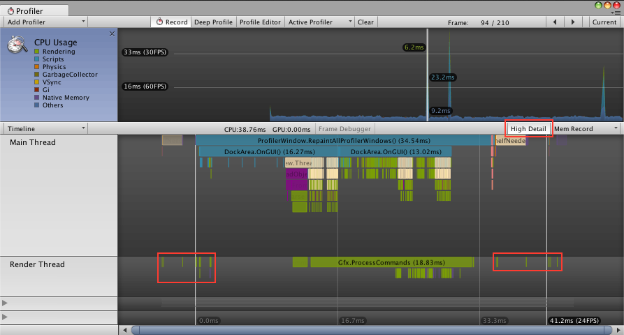
Timeline 的 High Detail 视图
CPU Usage Profiler Timeline 的 High Detail 视图为 Unity 的 CPU Usage Profiler 记录的每个样本提供至少一个宽度像素。
这样便可查看帧中所有活动的完整概况,包括线程同步或内存分配等短期活动。
To enable the High Detail view, go to Window > Analysis > Profiler to open the Profiler window. Select the CPU Usage Profiler (if it is not visible, click Add Profiler > CPU) then select the drop-down menu underneath the Profiler and click Timeline followed by High Detail.
比较
以下两个图显示了 CPU Usage Profiler Timeline 的 High Detail 视图与普通视图之间的区别。
High Detail 视图
普通视图