- Unity 用户指南 (2019.1)
- Unity 服务
- Unity Analytics
- Analytics Dashboard
- Overview page
Overview page
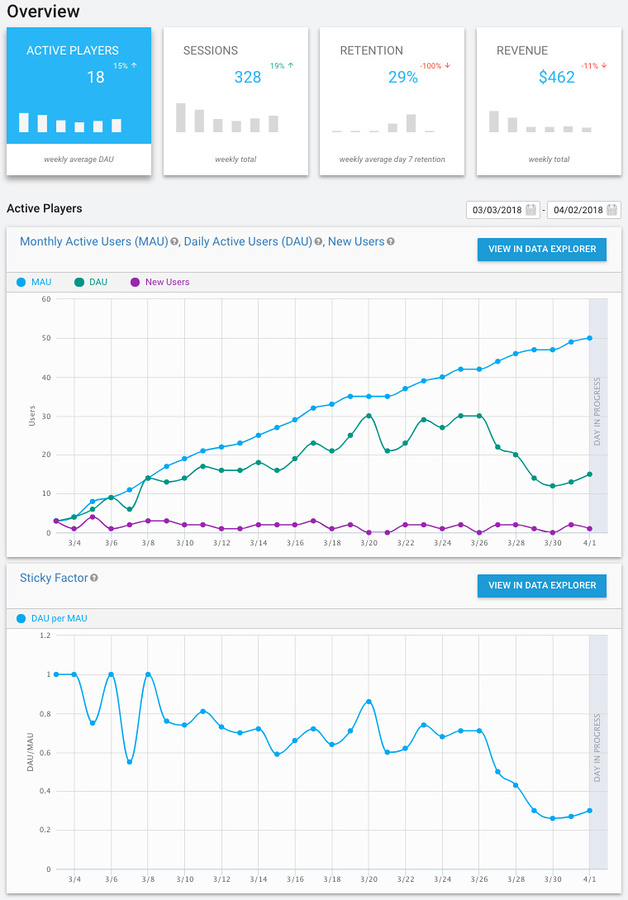
The Overview page of your Unity Analytics Dashboard provides a number of predefined charts that track commonly used metrics and key performance indicators. The overview page presents the charts in the following sections:
| Active Players | Shows how many players start to play your game as well as return to it over time. |
| Sessions | Shows how often and how long the average player plays your game each day. |
| Retention | Shows the percentage of players who return to the game at significant intervals. |
| Revenue | Shows reported, verified In-App Purchase (IAP) and Unity Ads revenue. |

对于这些部分中显示的每个图表,可选择要显示的日期范围。此外也可以单击 View in Data Explorer 按钮在 DataExplorer 选项卡中查看报告;此选项卡中提供了更多选项来选择、格式化和分析报告数据。
For more information about the metrics used on the Overview page and elsewhere on the Analytics Dashboard, see Analytics Metrics, Segments, and Terminology.
- 2017–08–29 Page published with editorial review
- Unity 2017.1 中的新功能
Copyright © 2019 Unity Technologies. Publication 2019.1